OpenArt Logo
Sign in

Model: OpenArt SDXL

Prompt:

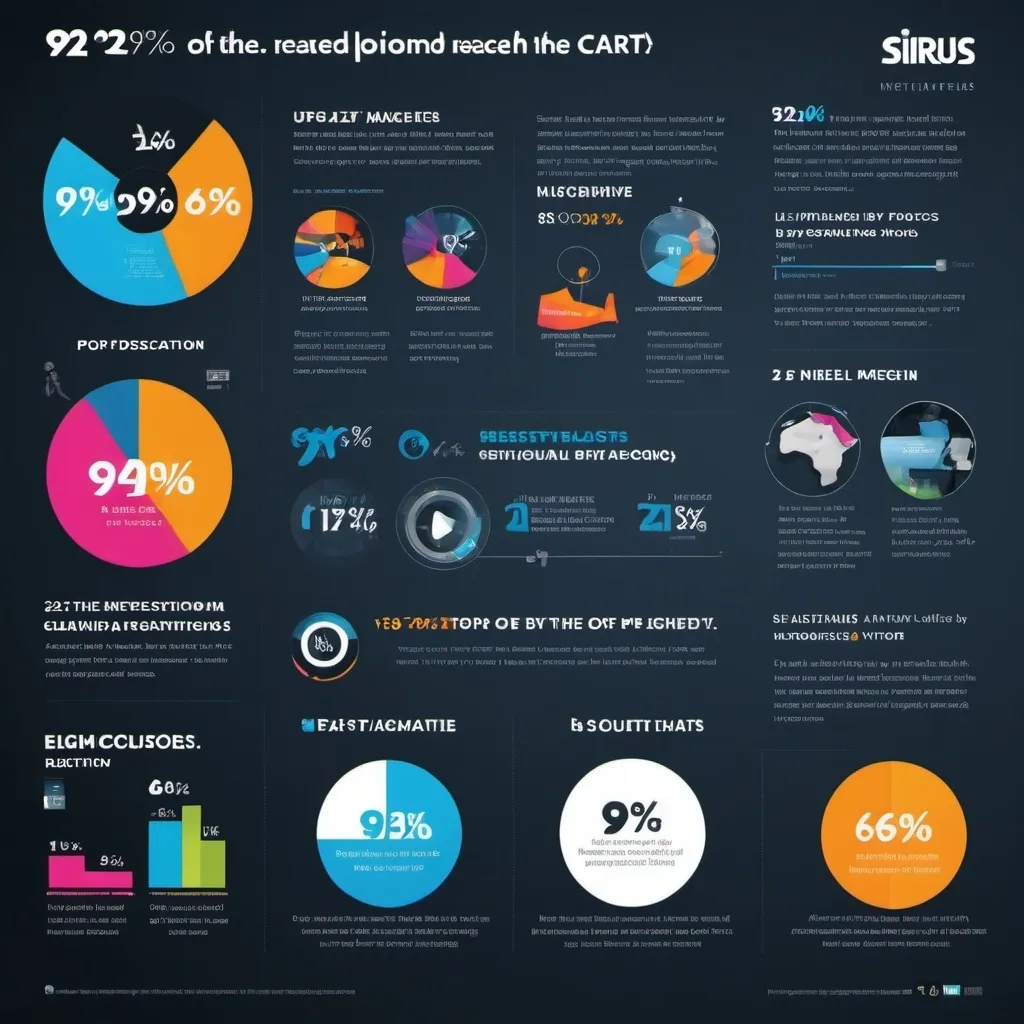
Create me a graphic which shows that 92% of the population is reached by Podcasts Networks and Sirius XM.
Width: 1024
Height: 1024
Scale: 7
Steps: 25
Seed: 559986497
Sampler: DPM++ 2M SDE Karras

Create your first image using OpenArt.

With over 100+ models and styles to choose from, you can create stunning images.
More images like this
Prompt: Create an infographic ranking financial stock parameters from most important to least important. Use a professional design with a mix of dark and light colors. Include the following parameters in order: 1. ROE (5Yrs Avg) > 20% 2. ROCE (5Yrs Avg) > 15% 3. PE < Industry PE 4. Sales Growth 3 Yrs > 15% 5. Profit Growth 5 Yrs > 15% 6. PEG Ratio < 1 7. D/E < 0.5 8. Promotor Holding > 50% 9. Pledged % < 1 10. OPM > 15% 11. EV/EBITDA < 25 12. Price to Sales < 10 13. MCap > 1000 Cr. The infographic should include a brief explanation for each parameter, highlighting its importance." Name it as Arun Subramaniam’s stock screener
Prompt: A picture graphic to demonstrate the impact and flow that HR data can have on strategic people decisions. More than a gut feeling.
Prompt: I can certainly help you conceptualize a background photo for your LinkedIn profile. While I can't create graphics directly, I can describe a design that you can either create yourself or have a graphic designer develop for you.Concept for LinkedIn Background PhotoTheme: AI, Data Analysis, and Machine LearningBackground Color:Opt for a sleek, modern color such as deep blue, dark gray, or gradient shades of blue to represent professionalism and tech.Central Visual Elements:Code Snippets: Overlay a few lines of code related to data analysis or AI. Examples include Python code snippets for data manipulation or machine learning algorithms. Ensure the code is not too dense to avoid clutter. Use a lighter color for the code to make it stand out against the background.Data Visualization: Incorporate subtle graphs or charts in the background to signify data analysis. You could include elements like scatter plots, bar graphs, or neural network diagrams.AI and Machine Learning Icons:Place icons or small illustrations of AI-related symbols, like neural networks, data pipelines, or a brain with circuits, subtly in the corners or integrated into the background. These should be understated so they don’t overpower the main elements.
Prompt: (presentation slide clipart), colorful design, modern and professional style, eye-catching visuals, data visualization elements, charts and graphs, engaging imagery, minimalist icons, vibrant color palette, sleek layout, high-quality vector graphics, suitable for business, clear and concise representation of data trends, appealing to prospective buyers, stimulating interest in purchase data analyses.
Prompt: how sticky session work?
Prompt: Comparison of Power Consumption Across Different IoT Communication Protocols" IN ENGLISH
IOT IS INTERNET OF THINGS
Prompt: 1. Create a digital infographic about shows opportunities and challenges in media and information.