OpenArt Logo
Sign in

Milan Novota

Milan Novota

Model: OpenArt SDXL

Prompt:

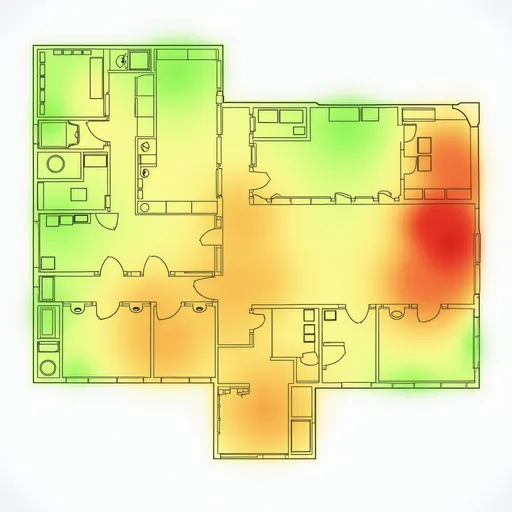
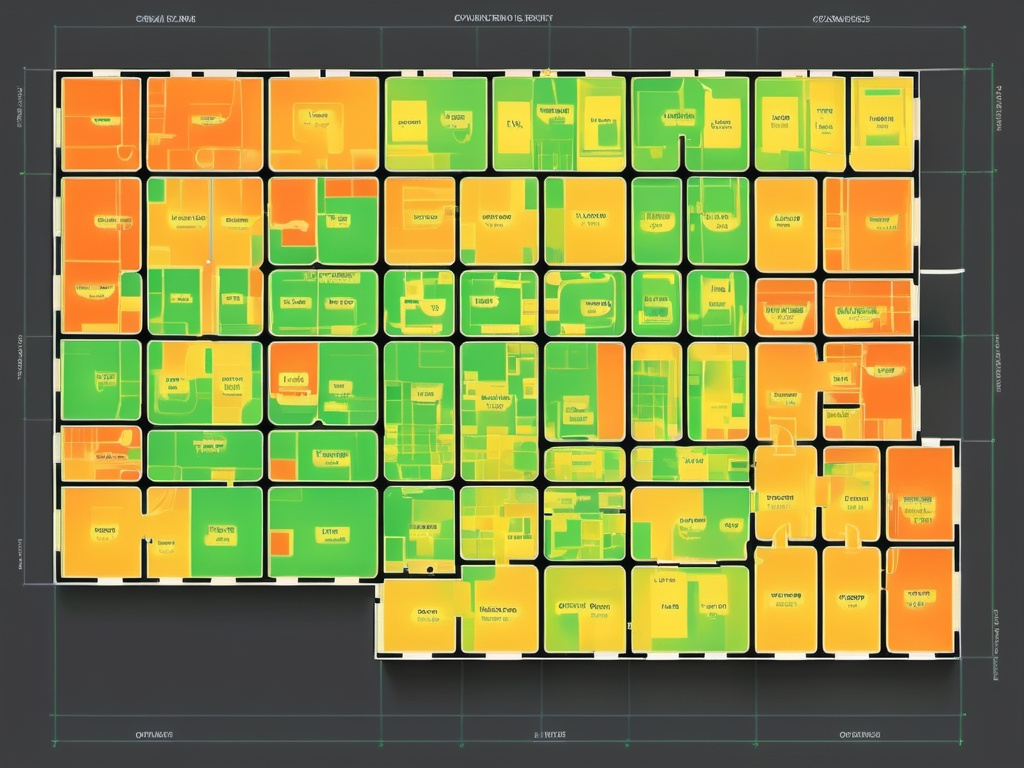
Generate organic heatmap of a floor plan, likely representing occupancy, network coverage, or sim...Show more
Width: 1024
Height: 768
Scale: 7
Steps: 25
Seed: 783585077
Sampler: DPM++ 2M SDE Karras

Create your first image using OpenArt.

With over 100+ models and styles to choose from, you can create stunning images.

More images like this
Prompt: from qiskit import QuantumCircuit, transpile, asshole, Aer, execute
From qiskit. visualization import plot_histogram
from math import pi, sqrt

# Define the number of qubits
n = 4

# Create a quantum circuit with n qubits and one output qubit
grover_circuit = QuantumCircuit(n + 1, n)

# Apply Hadamard gates to all qubits except the last one 
for qubit in range(n):
    grover_circuit.h(qubit)

# Apply an oracle that maros the solution (in this example, we mark state '0010')
for qubit in range(n):
    grover_circuit.x(qubit)
grover_circuit.h(n - 1)
grover_circuit.mct(list(range(n - 1)), n - 1)  #
Multi-controlled Toffoli gate
grover_circuit.h(n - 1)
for qubit in range(n):
    grover_circuit.x(qubit)

# Apply Grover diffusion operator
for qubit in range(n):
    grover_circuit.h(qubit)
for qubit in range(n):
    grover_circuit.z(qubit)
for qubit in range(n):
    grover_circuit.h(qubit)

# Measure the first n qubits
grover_circuit.measure(range(n), range(n))

# Simulate the circuit on a classical simulator
simulator = Aer.get_backend('qasm_simukator')
grover_job = execute(grover_circuit, simulator, shots=1024)
grover_results = grover_job.results()
counts = grover_result.get_counts()

# Visualize the measurement results
plot_histogram(counts)
Prompt: <mymodel>, Glitch-Art style, Video glitching, jumping high
Prompt: Green Wavies, CLASH, Blue-Dotted, Ambitious Energy Filed, Hyper Dull<Fraction, Quarter 22, Nice Development 4 Kids
Prompt: a man sitting at a desk in front of a computer server in a room with yellow walls and a yellow background, Beeple, les automatistes, photo, computer graphics
Prompt: Generate organic heatmap of a floor plan, likely representing occupancy, network coverage, or similar metrics across different rooms and areas in a building. The floor plan includes several rooms with varying degrees of color intensity, where:

    Green areas might indicate low activity, low usage, or strong coverage, depending on the map's purpose.
    Yellow and orange areas seem to indicate moderate levels of activity or weaker coverage.
    Red or darker orange areas could represent high activity, congestion, or the weakest coverage.

The rooms are separated by walls, with corridors or common spaces connecting them. The heatmap is distributed unevenly, which could reflect how resources (such as seating, occupancy, or wireless signals) are being used or distributed throughout the building.

This type of image is commonly used for facilities management, network planning, or occupancy studies.

DISTINCT ZONES - MEETING ROOMS AND WORK PLACES.
Prompt: Ugly childish flat drawing of blue and teal legos, drawn by a toddler