OpenArt Logo
Sign in

Błażej Łach

Błażej Łach

Model: AAM XL

Prompt:

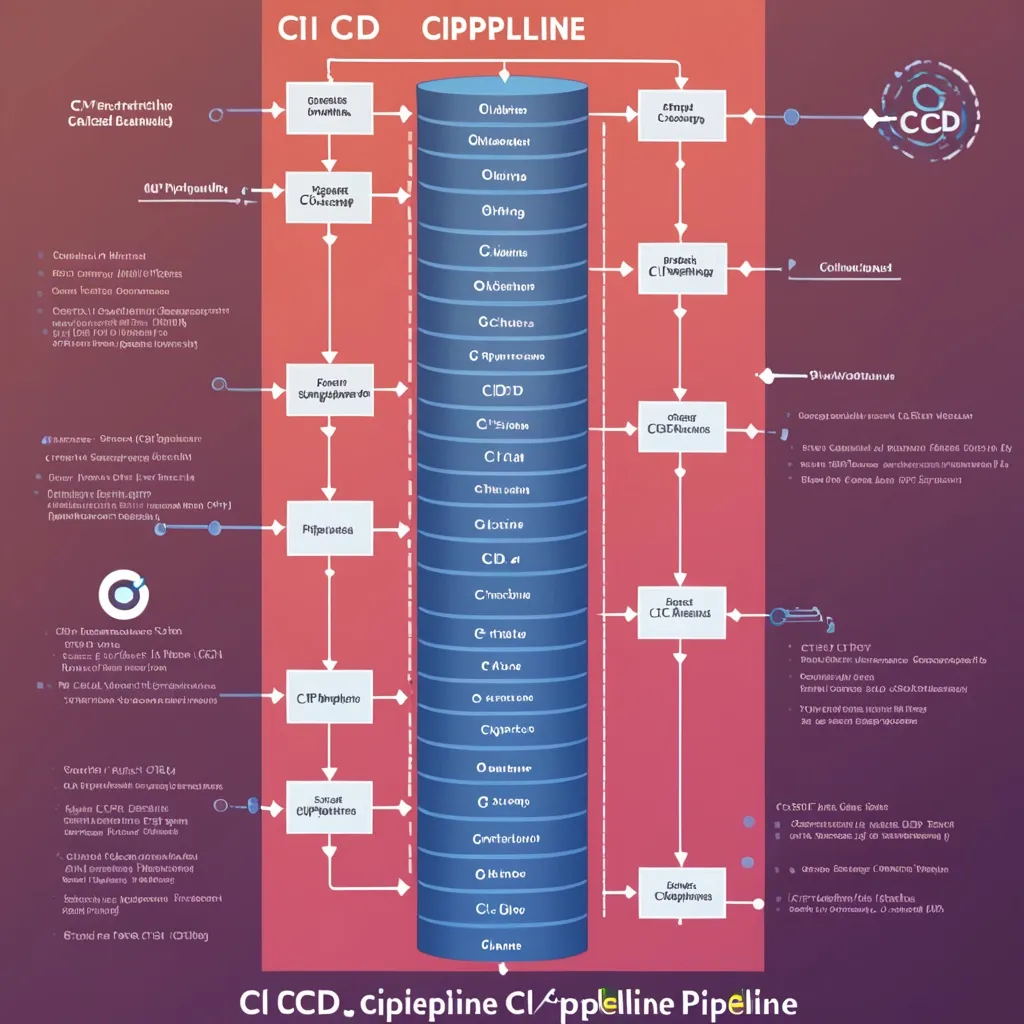
CI/CD pipeline
Width: 1024
Height: 1024
Scale: 7
Steps: 25
Seed: 926106735
Sampler: DPM++ 2M SDE Karras

Create your first image using OpenArt.

With over 100+ models and styles to choose from, you can create stunning images.
More images like this
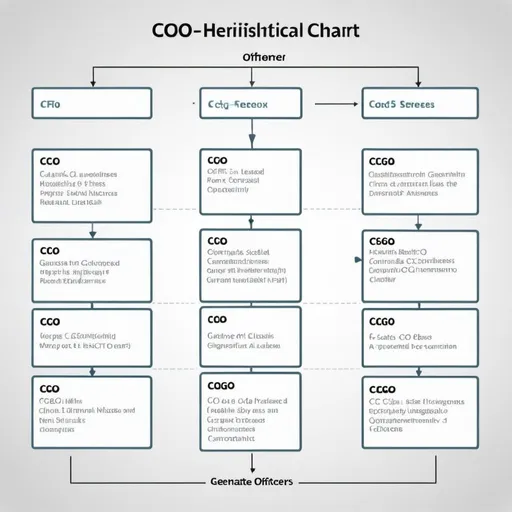
Prompt: Generate a classic heirarchical organizational chart for Assure Infusions. The chart is only 2 levels of hierarchy. At the top of the chart is a rectangle for the Board of Directors. Below the board are 3 corporate officers: CFO, COO and CGO. All 3 report to the board as shown by solid lines from each to the board. However, the COO is in the middle and is regarded as senior, or the C-Suite team leader. This relationship is shown by raising the COO box to 50% higher than the CFO and CGO boxes. The seniority is also shown by dotted lines from CFO to COO and from CGO to COO. So the chart only shows the 4 boxes and solid and dotted lines. generate the image
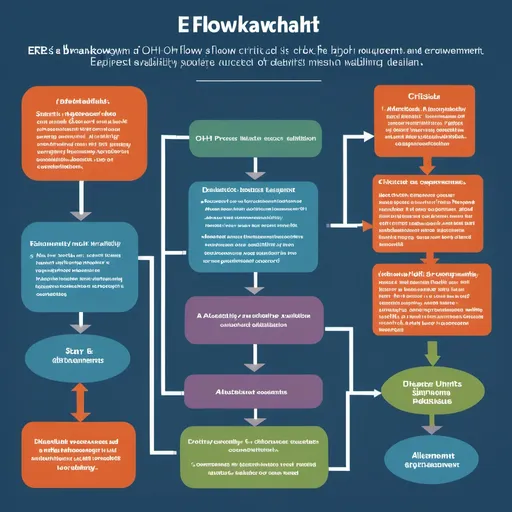
Prompt: ere's a breakdown of the flowchart:

Start: The process begins.
Assess EOH: Conduct a thorough check of current equipment availability and condition.
Identify Critical Shortages: Determine if any equipment is critically low or missing.
Notify Relevant Units: If shortages are identified, inform the affected units and provide details.
Allocate & Dispatch Resources: Distribute available resources to units in need, prioritizing based on the severity of shortages.
Update Inventory System: Log all transactions and updates to the inventory system.
Generate Reports: Create detailed reports summarizing shortages, resource allocation, and other relevant information.
Review & Implement Feedback: Evaluate the assessment process and make necessary adjustments for improvement.
End: The process concludes.
To create a visual flowchart, you can use:

Drawing software: Programs like Microsoft Visio, Lucidchart, or Draw.io can be used to create professional-looking flowcharts.
Online tools: There are many online tools available that allow you to create flowcharts without installing any software.
When creating your flowchart, consider using:

Shapes: Use shapes like rectangles, diamonds, and ovals to represent different types of steps.
Arrows: Connect shapes with arrows to indicate the flow of the process.
Text: Add text to labels and descriptions.
Color: Use color to differentiate between different steps or categories.
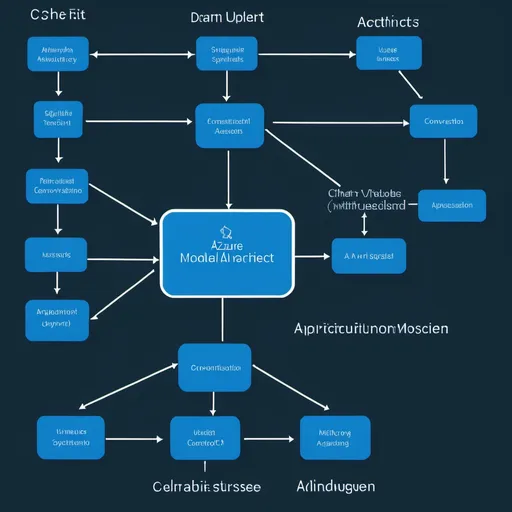
Prompt: hello, you are an azure solutions architect tasted with drawing an architecture diagram for an AI application to be hosted on Azure, the diagram is to start with the user sending in the request till they receive output, the AI application is called "Chat with CSV file and have conversations with contextual memory" serves the blow use case "allows users to upload and analyze data through conversational AI queries. The app provides an interactive interface for users to engage with data from the Titanic dataset or their own CSV files, facilitating a more intuitive and accessible approach to data exploration", it has to provide a file uploader for the user and incorporate a chat input field where users can type queries related to the data, and responses are generated using the integrated AI model. Could you help me with the azure architecture diagram from start to finish and describe the data flow?
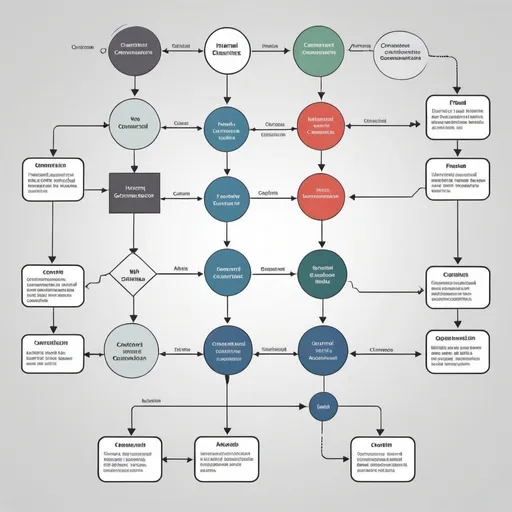
Prompt: Create a flowchart depicting the different internal and external communication channels inside a business organisation and the flow of information.
Prompt: Diagram showing input (e.g., prompts) → AI Processing → Output (e.g., text generation).
Prompt: EDUCATIONAL ECOSYSTEM GRAPH