OpenArt Logo
Sign in

Satinder Singh

Satinder Singh

Model: OpenArt SDXL

Prompt:

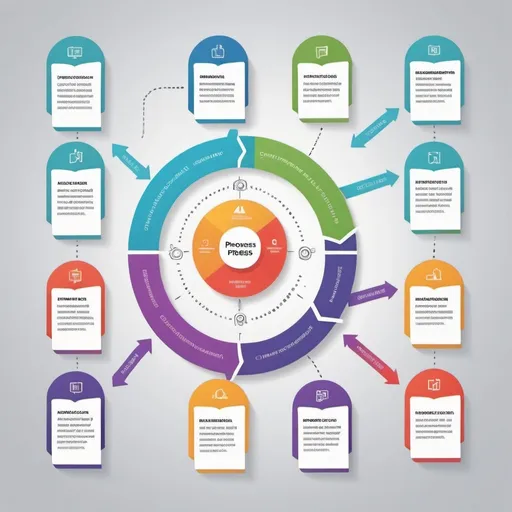
Give me an image containing sequential process with following 5 steps : 1. Purpose 2. Survey Population 3. Survey Format 4. Communicate the Concept 5. Measure Customer Response
Width: 1024
Height: 1024
Scale: 7
Steps: 25
Seed: 1032224202
Sampler: DPM++ 2M SDE Karras

Create your first image using OpenArt.

With over 100+ models and styles to choose from, you can create stunning images.

More images like this
Prompt: A flowchart leading to an AI chip, symbolizing decision pathways.
Prompt: create a process illustration with the following five items: Sourcing

Screening

Diligence Assessment  

Documentation and Structuring 

Asset Management
Prompt: "Create a digital illustration showing a flowchart or diagram of deadlock synchronization in operating systems. Include elements like semaphore symbols, resource allocation graphs, and a balanced scale to symbolize system stability. Use a tech-inspired color palette with shades of blue, green, and gray."
Prompt: Diagram showing input (e.g., prompts) → AI Processing → Output (e.g., text generation).
Prompt: Change the color of the highlighted areas to white
Prompt: Create a word map per the following list:
1.	Place "Mike Spack - Leader" in the center.
2.	Create main branches for: 
o	Career Goals
o	Personality Traits
o	Communication Skills 
o	Leadership Styles
3.	From each main branch, create smaller branches for each bullet point in the respective categories.
o	Career Goals
1.	Finance/accounting degree
2.	Non-profit CFO
3.	Continuous learning
4.	Strategic growth
5.	Impactful leadership
o	Personality Traits
1.	Highly conscientious
2.	Extraverted communicator
3.	Goal-oriented achiever
4.	Innovative problem-solver
5.	Adaptable decision-maker
o	Communication Skills
1.	Clear communicator
2.	Persuasive influencer
3.	Confident presenter
4.	Adaptable style
5.	Regular check-ins
6.	Impatient listener
7.	Domineering tendency
8.	Rushed information
o	Leadership Styles
1.	Delegating approach
2.	Goal-oriented direction
3.	Transformational vision
4.	Adaptive leadership
5.	Results-driven focus
4.	Use different colors for each main category to make the map visually distinct.
5.	Use font sizes to indicate importance or frequency of traits mentioned.
6.	Consider using icons or small illustrations to represent key concepts (e.g., a graduation cap for education goals, a megaphone for communication skills).
Prompt: a project timeline where multiple straight  blue green yellow red lines and dots merge into other lines
Prompt: how sticky session work?
Prompt: Create a flowchart depicting the different internal and external communication channels inside a business organisation and the flow of information.
Prompt: I want a modern information  architecture that shows people how information exists in components that can be reused across information domains. This is developers to understand how they exist in the informatoin flow and can use the information from anywhere. The information is format agnostic. This is in the telecoms and IT world.