OpenArt Logo
Sign in

K4Soma

K4Soma

Model: OpenArt SDXL

Prompt:

Generate image to show following to prepare presentation for leadership. Insourcing Technology...Show more
Width: 1024
Height: 1024
Scale: 7
Steps: 25
Seed: 1886092593
Sampler: DPM++ 2M SDE Karras

Create your first image using OpenArt.

With over 100+ models and styles to choose from, you can create stunning images.
More images like this
Prompt: Create an engaging graphic for our strategic plan, illustrating three distinct phases with clear visual separation. The graphic should be designed to be used on the Ideogram website and must include the following:

Phase One (by end of FY2025):

Title: "Design and Launch"
Imagery: Use visuals like blueprint designs, rocket launches, or planning meetings to represent the initiation phase.
Elements: Include a microphone symbolizing the start of our radio initiatives.
Phase Two (by end of FY2029):

Title: "Operationalize"
Imagery: Show active operations with visuals like a bustling newsroom, broadcasting scenes, or advanced technology in use.
Elements: Keep the microphone symbol to represent ongoing radio operations.
Phase Three (by FY2030):

Title: "Ideal State"
Imagery: Illustrate our global reach with a world map, connecting lines, diverse audiences, and expanded media channels.
Elements: Include the microphone to signify our established global radio presence, along with symbols indicating growth and impact.
Ensure the microphone is prominently featured in each phase to emphasize our radio commitment throughout our evolution. The overall design should be cohesive, visually engaging, and suitable for display on the Ideogram website, reflecting our journey towards becoming a truly global media organization and doubling our impact.
Prompt: A picture graphic to demonstrate the impact and flow that HR data can have on strategic people decisions. More than a gut feeling.
Prompt: Create a word map per the following list:
1.	Place "Mike Spack - Leader" in the center.
2.	Create main branches for: 
o	Career Goals
o	Personality Traits
o	Communication Skills 
o	Leadership Styles
3.	From each main branch, create smaller branches for each bullet point in the respective categories.
o	Career Goals
1.	Finance/accounting degree
2.	Non-profit CFO
3.	Continuous learning
4.	Strategic growth
5.	Impactful leadership
o	Personality Traits
1.	Highly conscientious
2.	Extraverted communicator
3.	Goal-oriented achiever
4.	Innovative problem-solver
5.	Adaptable decision-maker
o	Communication Skills
1.	Clear communicator
2.	Persuasive influencer
3.	Confident presenter
4.	Adaptable style
5.	Regular check-ins
6.	Impatient listener
7.	Domineering tendency
8.	Rushed information
o	Leadership Styles
1.	Delegating approach
2.	Goal-oriented direction
3.	Transformational vision
4.	Adaptive leadership
5.	Results-driven focus
4.	Use different colors for each main category to make the map visually distinct.
5.	Use font sizes to indicate importance or frequency of traits mentioned.
6.	Consider using icons or small illustrations to represent key concepts (e.g., a graduation cap for education goals, a megaphone for communication skills).
Prompt: {
  "prompt": "A linear timeline infographic titled 'Soils: The Foundation of Sustainable Development'. The top has a header with an image of soil and roots. The left column features icons and brief descriptions for 'People' (Family icon, 'Food Security & Livelihoods'), 'Prosperity' (Coins icon, 'Economic Growth & Poverty Reduction'), 'Planet' (Tree icon, 'Climate Mitigation & Biodiversity'), 'Peace' (Peace Symbol icon, 'Conflict Prevention & Resource Management'), and 'Partnership' (Globe with Network icon, 'Global Cooperation & Knowledge Sharing'). The right column includes visual elements: a graph for improved crop yields (People), an infographic of increased GDP (Prosperity), a pie chart for carbon sequestration (Planet), a map showing reduced conflicts (Peace), and a diagram of international projects (Partnership). The bottom has a call to action with a quote or statistic on the importance of soils in achieving the SDGs. The color scheme uses vibrant colors to differentiate each section while keeping a cohesive look.",
  "size": "1792x1024"
}
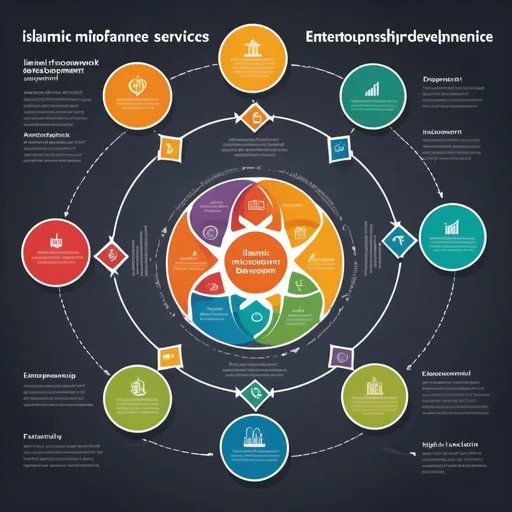
Prompt: (diagram illustrating conceptual framework), relationship between (Islamic microfinance services) and (entrepreneurship development), intermediary factors, (financial inclusion), (business growth), socio-economic impact, logical flow, graphical representation, professional, clear labels, modern design, (highly detailed), vibrant colors, infographics style, educational use, analytical, suitable for presentations, (4K quality).
Prompt: {
  "prompt": "Create an infographic that clearly organizes the provided information into a visually appealing and structured format. The infographic should have distinct sections with headers for each main component: Governance, Policies, Reporting, Strategy, Strategic Objectives, Innovation & Growth, Processes, Supporting Functions, Compliance & Monitoring, Technology, Applications, Security, People, Talent Management, Culture & Values, Risk Management, Risk Mitigation, Incident Management, Customer, Customer Segmentation, Customer Retention, Financials, Cost Structure, Financial Planning & Analysis, Compliance, Audit & Assurance, Reporting & Disclosure, Partnerships, Vendor Management, and Collaboration & Ecosystem. Each section should be divided into three levels of detail, with sub-sections and bullet points as necessary to display all the detailed information provided. Use a professional color scheme, with each main component having a unique color to differentiate it from the others. Include icons or small graphics to represent each component where appropriate, ensuring the text is clear and readable.",
  "size": "1792x1024"
}
Prompt: Create a flowchart with images of dentistry illustrating the different omics technologies (genomics, proteomics, metabolomics, culturomics, transcriptomics) and their applications in dental research.  ( no unwanted datas in the figure)
Prompt: EDUCATIONAL ECOSYSTEM GRAPH
Prompt:  Leaders & Innovation