OpenArt Logo
Sign in

Tommaso Azzolini

Tommaso Azzolini

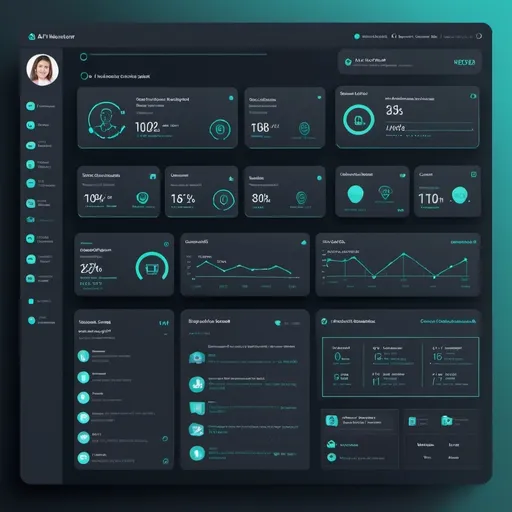
Model: OpenArt SDXL

Prompt:

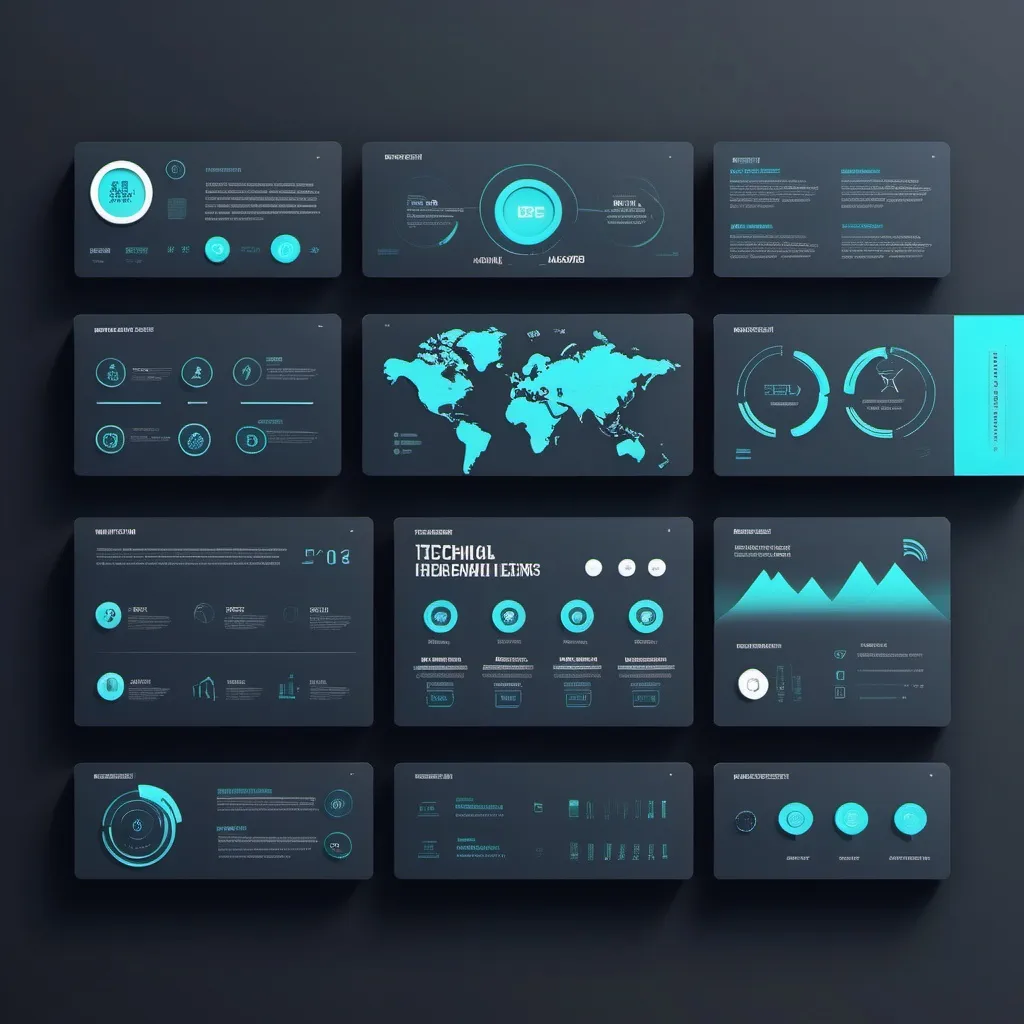
(technical screen design), corporate style, cool color scheme, sleek and modern interface, user-f...Show more
Width: 1024
Height: 1024
Scale: 7
Steps: 25
Seed: 1603907200
Sampler: DPM++ 2M SDE Karras

Create your first image using OpenArt.

With over 100+ models and styles to choose from, you can create stunning images.
More images like this
Prompt: Dashboard for AI Contact Center
Prompt:
Prompt:  Google Analytics accounts.
Prompt: I can certainly help you conceptualize a background photo for your LinkedIn profile. While I can't create graphics directly, I can describe a design that you can either create yourself or have a graphic designer develop for you.Concept for LinkedIn Background PhotoTheme: AI, Data Analysis, and Machine LearningBackground Color:Opt for a sleek, modern color such as deep blue, dark gray, or gradient shades of blue to represent professionalism and tech.Central Visual Elements:Code Snippets: Overlay a few lines of code related to data analysis or AI. Examples include Python code snippets for data manipulation or machine learning algorithms. Ensure the code is not too dense to avoid clutter. Use a lighter color for the code to make it stand out against the background.Data Visualization: Incorporate subtle graphs or charts in the background to signify data analysis. You could include elements like scatter plots, bar graphs, or neural network diagrams.AI and Machine Learning Icons:Place icons or small illustrations of AI-related symbols, like neural networks, data pipelines, or a brain with circuits, subtly in the corners or integrated into the background. These should be understated so they don’t overpower the main elements.
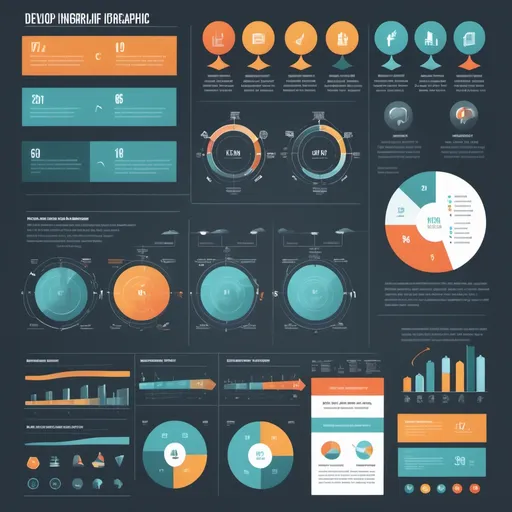
Prompt: Develop an infographic layout that follows best practices for visual hierarchy and information flow. Use a combination of charts, graphs, icons, and illustrations to present information in a structured and easily understandable manner: irn 20 us 60
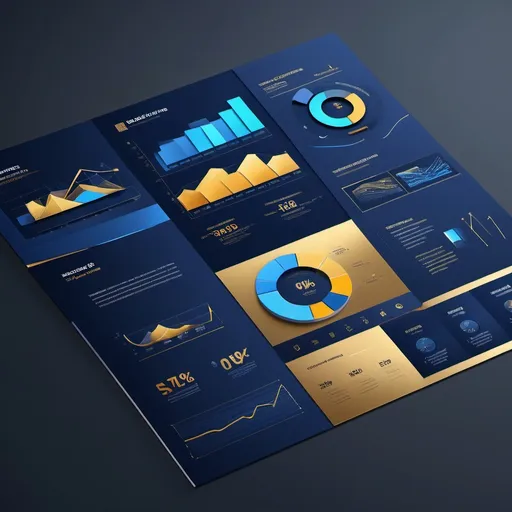
Prompt: (bold text "Estimated Annual Revenue: $60M"), (Financial visualization), modern and sleek design, displaying revenue figures creatively, sophisticated color palette with deep blues and metallic gold accents, engaging and informative ambiance, high-quality graphics, clear charts and infographics, clean and professional layout, ultra-detailed and impactful presentation for business insights.
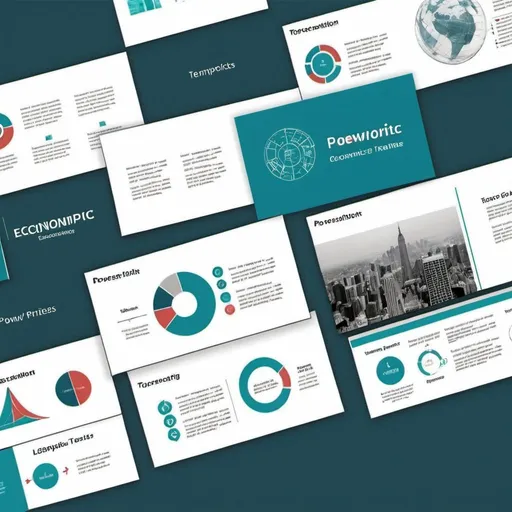
Prompt: Powerpoint template for economics topic
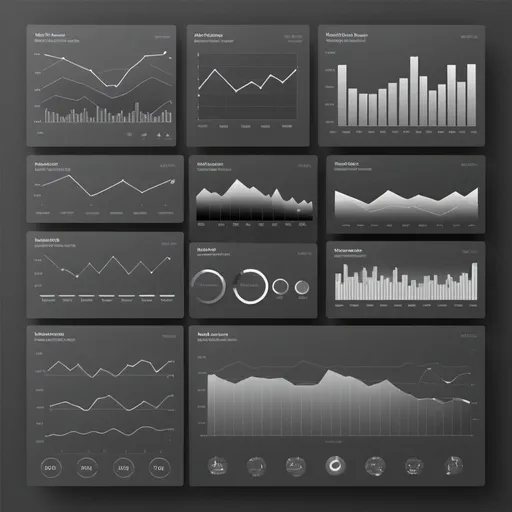
Prompt: create an image of data visualization charts in different shades of grey
Prompt: generate illustrations for a professional presentation regarding agile methodology applicate to design of data products
Prompt: a bunch of different types of info graphics, including graphs and numbers, with a blue background with orange and black accents, Andries Stock, objective abstraction, extreme illustration, a wireframe diagram