OpenArt Logo
Sign in

Mohammad Owais

Mohammad Owais

Model: OpenArt SDXL

Prompt:

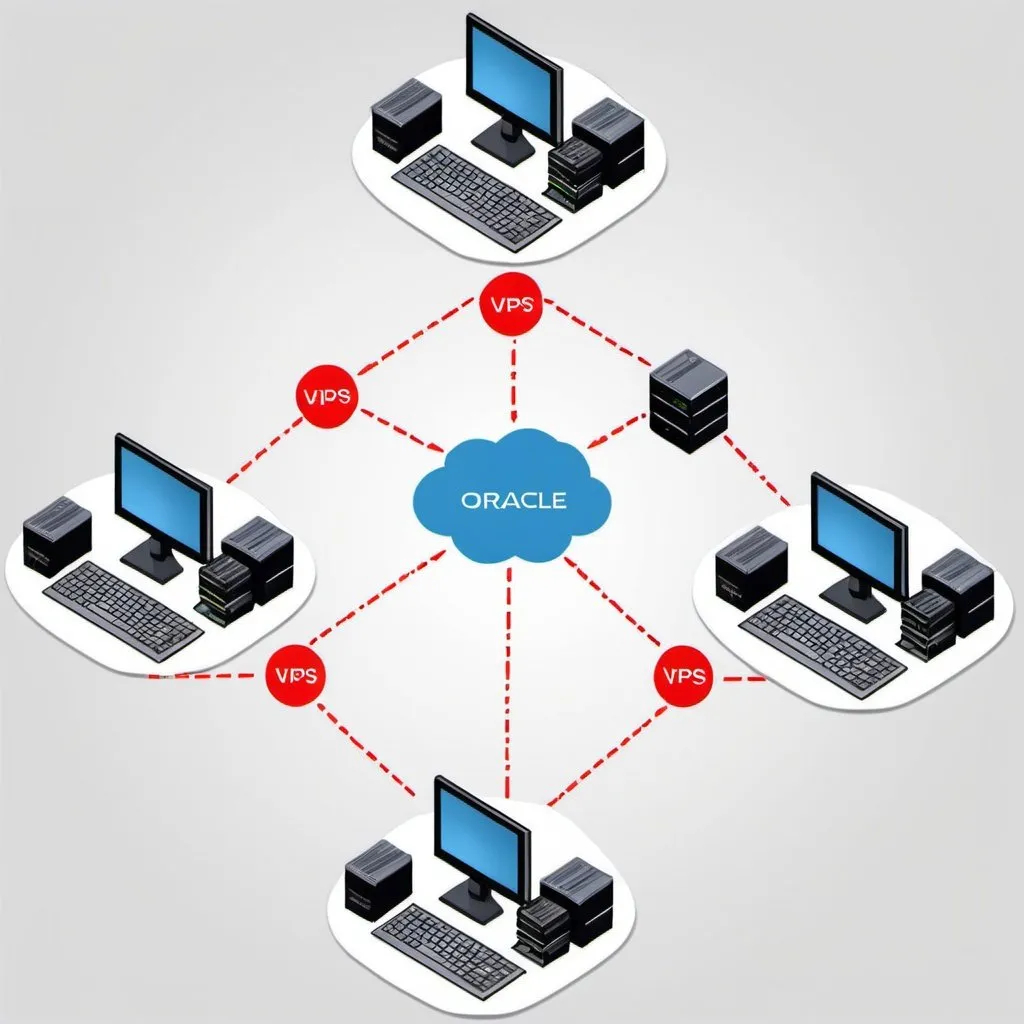
Create 1 image which shows Site A contains Group A of 2 VPS and Group B of 2 VPS Group A vps connect with each other as an IIS Farm and Group B VPS connected with each other as Oracle Cluster
Width: 1024
Height: 1024
Scale: 7
Steps: 25
Seed: 422950727
Sampler: DPM++ 2M SDE Karras

Create your first image using OpenArt.

With over 100+ models and styles to choose from, you can create stunning images.
More images like this
Prompt: A banner showcasing cloud computing with cloud icons, data transfer symbols, and server illustrations. Use a light blue and white color scheme to convey the concept of cloud technology.
Prompt: Mastering Data: The Best Tech Stacks for Enthusiasts Revealed
Welcome, fellow data enthusiasts! In this exhilarating journey through the realm of data technology, we'll explore the most potent tools and frameworks that empower you to wield the magic of data. From cloud platforms like AWS and Azure to powerful analytics engines like Hadoop and Spark, there's a treasure trove of possibilities waiting to be discovered. Whether you're a seasoned data wizard or just starting your adventure, this guide will illuminate the path to building your dream tech stack.

The Powerhouses: AWS and Azure

At the heart of modern data operations lie the cloud giants AWS and Azure. These platforms offer a vast array of services tailored to data processing, storage, and analysis. With AWS's Redshift and Azure's data services, you can effortlessly scale your data infrastructure to meet growing demands. Both platforms provide seamless integration with popular analytics tools like Hadoop, Spark, and SQL databases, making them indispensable for any data enthusiast.
Prompt: kan je een grafisch overzicht maken 
 met nederlandse uitleg in woorden erbij van het IT integratielandschap met daarbij applicaties, cloud omgevingen en middlewere?
Prompt: a poster with a cloud and various icons on it, including data, data, and other things that are depicted, Enguerrand Quarton, objective abstraction, detailed illustration, a digital rendering
Prompt: Network automation
Prompt: SAP Business One uses a client-server architecture. This means that the system is divided into two main parts: the client (front-end) and the server (back-end). The client is the user interface where users interact with the application, while the server is responsible for processing business logic and managing the database. The architecture is designed to allow multiple users to access and work with the system simultaneously, providing a scalable and efficient solution for small to medium-sized enterprises.
Prompt: "Create an image that illustrates the process of transmitting information. Show the flow of information from a sender to a receiver, highlighting the steps involved in encoding, transmitting, receiving, and decoding. Depict various communication channels such as wired and wireless networks, satellite communications, and fiber optic cables, with devices like computers, smartphones, radios, and satellites facilitating communication. Illustrate the use of modern technologies like email, instant messaging, social media, video conferencing, and cloud storage, with interfaces showing messages being composed, sent, and received. Include traditional methods of communication such as postal mail, telegraphs, and landline telephones in a historical context. Show the process of encoding information into transmittable formats (e.g., text, audio, video) and decoding it back for the receiver, using examples like binary code, Morse code, and data compression. Depict the physical transmission of signals through electromagnetic waves, radio waves, and light signals in fiber optics, illustrating their propagation through space, cables, and air. Illustrate the network infrastructure supporting information transmission, including servers, data centers, routers, and communication towers, with a network diagram connecting different devices and systems. Highlight global connectivity with a map or globe, showing lines representing information transmission across continents and countries, and satellites orbiting the earth to enable global communication." in Africans Lagos Nigeria
Prompt: Create an image that visually represents the concept of a star topology in networking. Show a central hub or server in the middle with multiple computers or devices connected to it in a star-like pattern. Each computer should have a direct line connecting it to the central hub. in Africa Lagos Nigeria
Prompt: secure network configuration and migration for my website
Prompt: Illustration Public key infrastructure
Prompt: cloud backup
Prompt: 	Finance	leaders	need	to	accelerate	the	move	
to	cloud-based	ERPs,	if	not	already	done	so.	It	
provides	significant	opportunities	to	standardize	
processes,	automate	key	activities,	and	enhance	
data	security.	They	must	take	a	hard	look	at	
f
 inance	technology	and	decide	what	you	truly	
need	to	customize.	Prepackaged	solutions	exist	
for	almost	any	need.
Prompt: A banner showcasing cloud computing with cloud icons, data transfer symbols, and server illustrations. Use a light blue and white color scheme to convey the concept of cloud technology.
Prompt: Mastering Data: The Best Tech Stacks for Enthusiasts Revealed
Welcome, fellow data enthusiasts! In this exhilarating journey through the realm of data technology, we'll explore the most potent tools and frameworks that empower you to wield the magic of data. From cloud platforms like AWS and Azure to powerful analytics engines like Hadoop and Spark, there's a treasure trove of possibilities waiting to be discovered. Whether you're a seasoned data wizard or just starting your adventure, this guide will illuminate the path to building your dream tech stack.

The Powerhouses: AWS and Azure

At the heart of modern data operations lie the cloud giants AWS and Azure. These platforms offer a vast array of services tailored to data processing, storage, and analysis. With AWS's Redshift and Azure's data services, you can effortlessly scale your data infrastructure to meet growing demands. Both platforms provide seamless integration with popular analytics tools like Hadoop, Spark, and SQL databases, making them indispensable for any data enthusiast.
Prompt: (Cloud computing course), sleek design, modern themes, educational layout, high-tech elements, vibrant colors, interactive features, student-focused setting, engaging visuals, user-friendly interface, professional and polished aesthetics, atmospheric lighting, clear and concise information presentation, stimulating learning environment, ultra-detailed, HD.
Prompt: A team of office worker getting multiple streams of information through various devices like phone, lap top, tablets, TV
Prompt: "Create an image that illustrates the process of transmitting information. Show the flow of information from a sender to a receiver, highlighting the steps involved in encoding, transmitting, receiving, and decoding. Depict various communication channels such as wired and wireless networks, satellite communications, and fiber optic cables, with devices like computers, smartphones, radios, and satellites facilitating communication. Illustrate the use of modern technologies like email, instant messaging, social media, video conferencing, and cloud storage, with interfaces showing messages being composed, sent, and received. Include traditional methods of communication such as postal mail, telegraphs, and landline telephones in a historical context. Show the process of encoding information into transmittable formats (e.g., text, audio, video) and decoding it back for the receiver, using examples like binary code, Morse code, and data compression. Depict the physical transmission of signals through electromagnetic waves, radio waves, and light signals in fiber optics, illustrating their propagation through space, cables, and air. Illustrate the network infrastructure supporting information transmission, including servers, data centers, routers, and communication towers, with a network diagram connecting different devices and systems. Highlight global connectivity with a map or globe, showing lines representing information transmission across continents and countries, and satellites orbiting the earth to enable global communication." in Africans Lagos Nigeria
Prompt: AWS Essential explain like story
Prompt: Schematic drawing depicting the relationship between artificial intelligence services and library services for the development of academic research.
Prompt: Create a product offering image using the below content: Custom Software Development- cutting edge custom software for your unique needs, including front-end & back-end technology QA and testing- Make your technology durable and scalable with automated and manual testing Mobile App Development- Scalable, high functioning, and secure mobile apps for iOS and Android devices. Cloud and On-Prem Infrastructure- Enabling application stability and fault-resistance with our Security and DevOps engineers. UI/UX Design- Building beautiful user friendly designs that make your customers' lives easier. Data Solutions- Maximizing your data’s value with modern AI, machine learning, and Data Engineering best practices.
Prompt: a diagram of a computer and a monitor connected to a network of devices and devices with a person sitting at a desk, Ben Thompson, holography, isometric view, a wireframe diagram
Prompt: challenges faced by startups, related to Web3 and futuristic
Prompt: A system of computer network connected together and in animation
Prompt: Innovative Approaches in IoT System Design: Exploring Scalability, Security, and Real-time Data Processing FOR RESEARCH PAPER
Prompt: A banner showcasing cloud computing with cloud icons, data transfer symbols, and server illustrations. Use a light blue and white color scheme to convey the concept of cloud technology.
Prompt: a diagram of a computer system with many different components and numbers on it, including some of the components, database schema, R+V blueprint, a wireframe diagram, Microsoft, SAP, many statistics
Prompt: Cyber ​​data center in the center of the picture
Connects to 10 printers that are in a circle around the center