OpenArt Logo
Sign in

Pradyut Das

Pradyut Das

Model: OpenArt SDXL

Prompt:

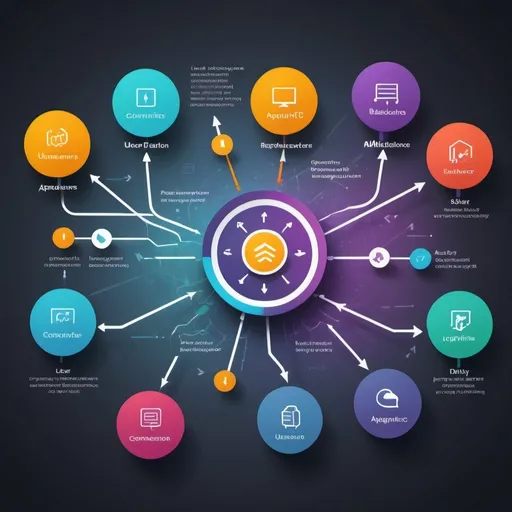
Create an image that can be used in your PPT to illustrate the importance of structured Active Di...Show more
Width: 1024
Height: 1024
Scale: 7
Steps: 25
Seed: 1264910207
Sampler: DPM++ 2M SDE Karras

Create your first image using OpenArt.

With over 100+ models and styles to choose from, you can create stunning images.
More images like this
Prompt: "Create a digital illustration showing a flowchart or diagram of deadlock synchronization in operating systems. Include elements like semaphore symbols, resource allocation graphs, and a balanced scale to symbolize system stability. Use a tech-inspired color palette with shades of blue, green, and gray."
Prompt: EDUCATIONAL ECOSYSTEM GRAPH
Prompt: a drawing of a business plan with a lot of things on it and a person standing in front of it, Art & Language, objective abstraction, detailed illustration, a wireframe diagram. according to this picture you need to generate a picture on the topic, plan, expectations, communication, roles of players in the team, presentation of participants
Prompt: Create a word map per the following list:
1.	Place "Mike Spack - Leader" in the center.
2.	Create main branches for: 
o	Career Goals
o	Personality Traits
o	Communication Skills 
o	Leadership Styles
3.	From each main branch, create smaller branches for each bullet point in the respective categories.
o	Career Goals
1.	Finance/accounting degree
2.	Non-profit CFO
3.	Continuous learning
4.	Strategic growth
5.	Impactful leadership
o	Personality Traits
1.	Highly conscientious
2.	Extraverted communicator
3.	Goal-oriented achiever
4.	Innovative problem-solver
5.	Adaptable decision-maker
o	Communication Skills
1.	Clear communicator
2.	Persuasive influencer
3.	Confident presenter
4.	Adaptable style
5.	Regular check-ins
6.	Impatient listener
7.	Domineering tendency
8.	Rushed information
o	Leadership Styles
1.	Delegating approach
2.	Goal-oriented direction
3.	Transformational vision
4.	Adaptive leadership
5.	Results-driven focus
4.	Use different colors for each main category to make the map visually distinct.
5.	Use font sizes to indicate importance or frequency of traits mentioned.
6.	Consider using icons or small illustrations to represent key concepts (e.g., a graduation cap for education goals, a megaphone for communication skills).
Prompt: Entrepreneurs Can be Classified Into Various Types
Prompt: how sticky session work?
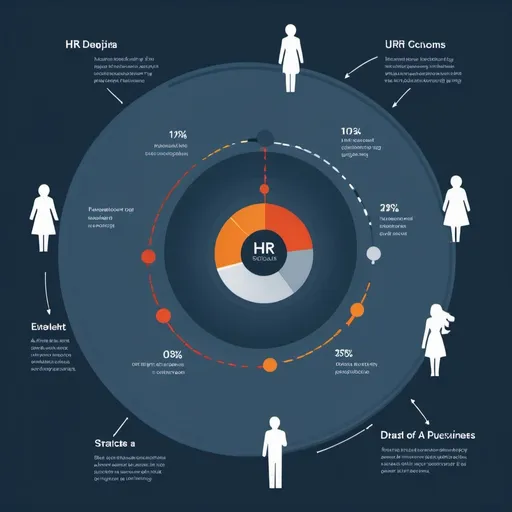
Prompt: A picture graphic to demonstrate the impact and flow that HR data can have on strategic people decisions. More than a gut feeling.
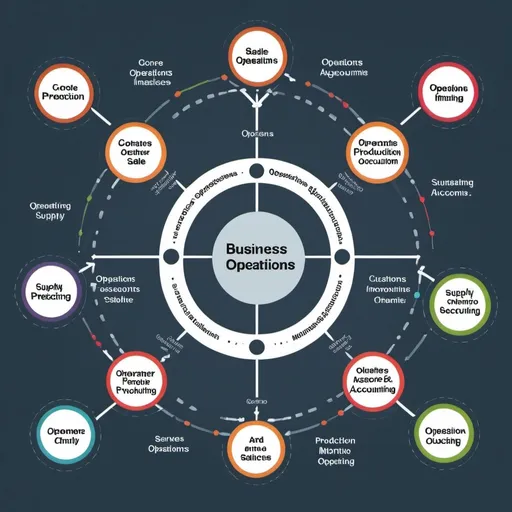
Prompt: create an image of business operations: core operations are production/operations, research & development, sales & marketing. Supporting operations are finance & accounting, human resources, information technology, supply chain management, customer services.
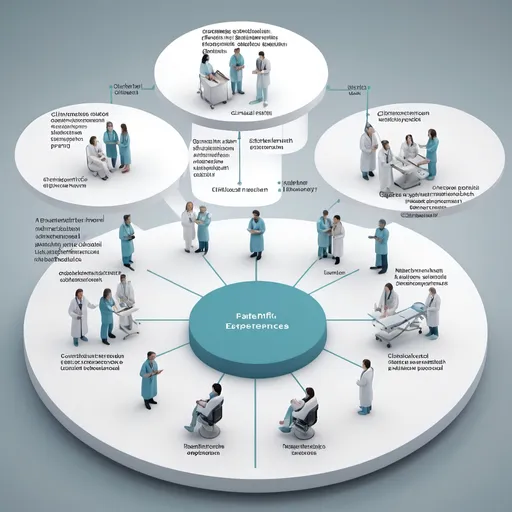
Prompt: an organisational structure with multiple patient experiences on one dimension, multiple scientific platforms on another dimension, and clinical research areas on the final dimension. The patient experiences can span the clinical research areas. The scientific platforms can be relevant to multiple clinical problems. 

Make the image a 3D model to match the structure