OpenArt Logo
Sign in

Fulton Analytics

Fulton Analytics

Model: OpenArt SDXL

Prompt:

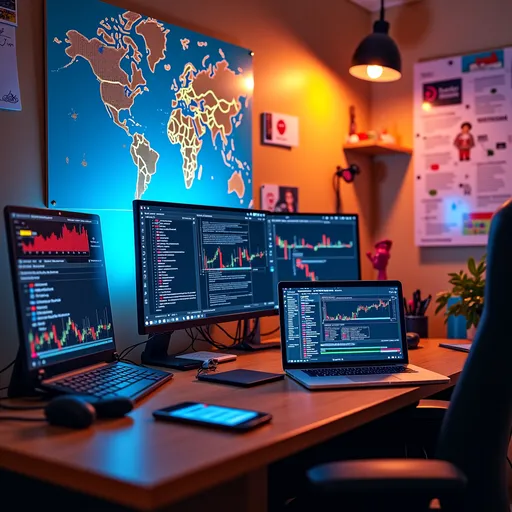
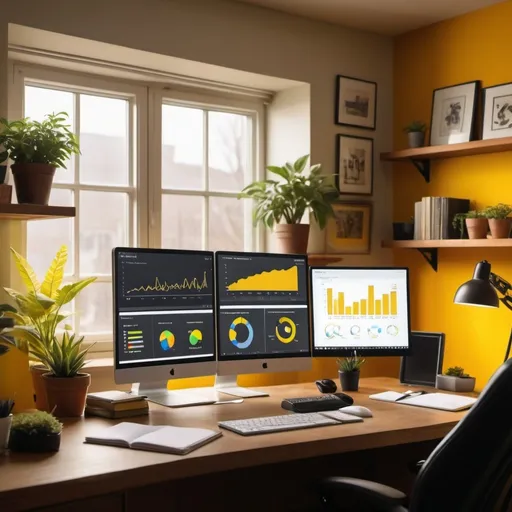
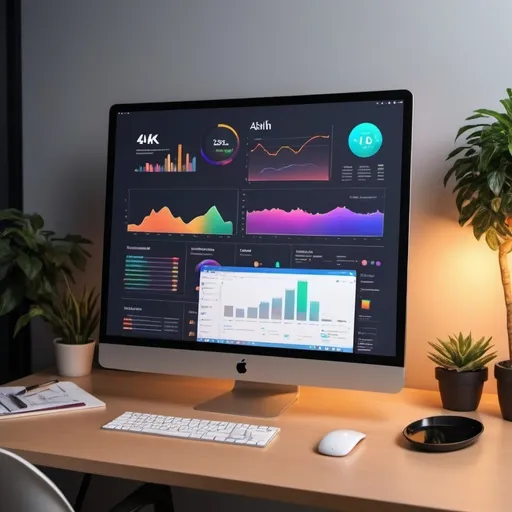
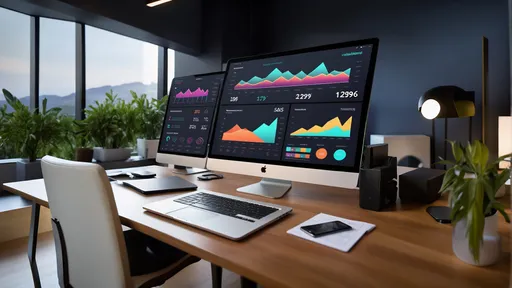
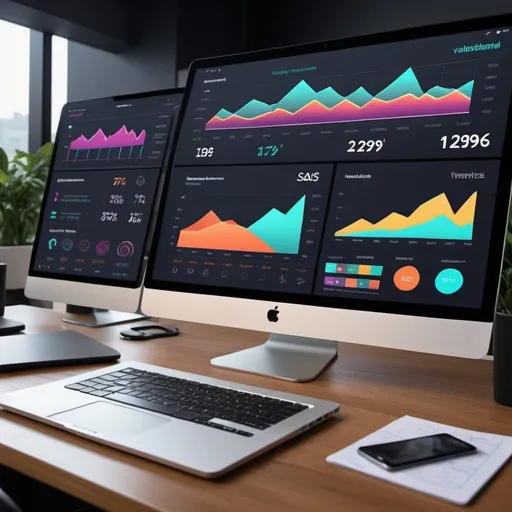
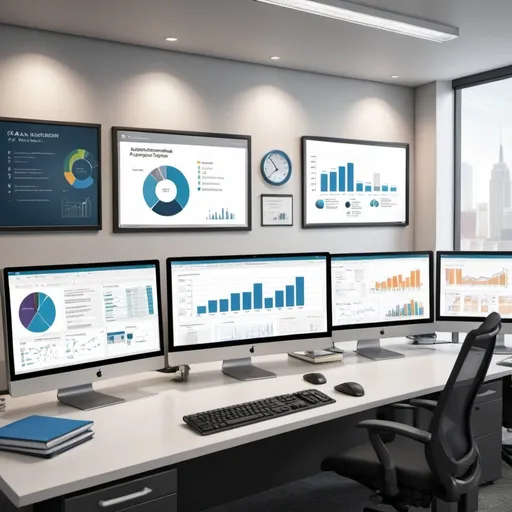
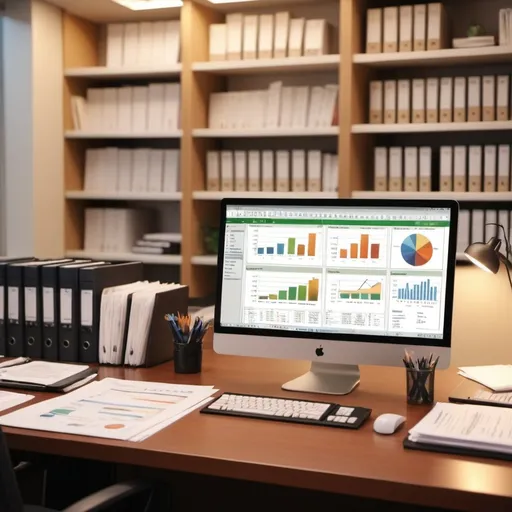
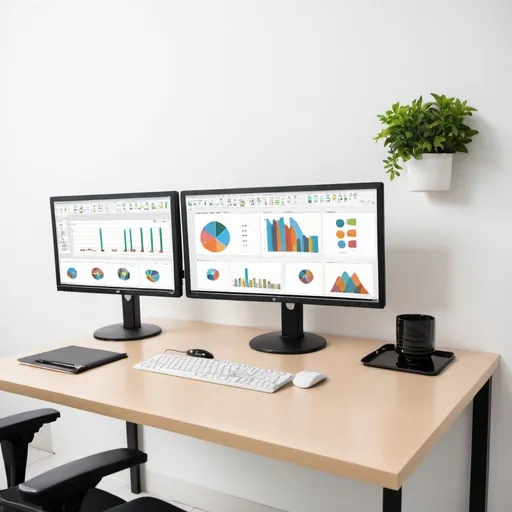
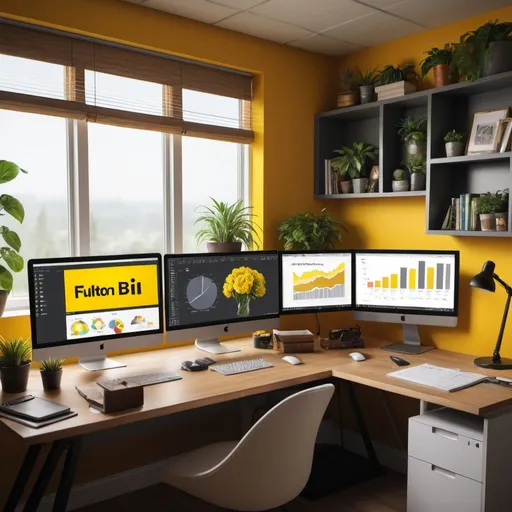
Power BI dashboard with the a developer working on it in their home office
Width: 1024
Height: 1024
Scale: 7
Steps: 25
Seed: 292394373
Sampler: DPM++ 2M SDE Karras

Create your first image using OpenArt.

With over 100+ models and styles to choose from, you can create stunning images.
More images like this
Prompt: I want a photo that I can put in my linked in that describe a cpa it auditor , itgc, application control and analytical skills not to see people. I want a color picture
Prompt: Unlock the power of data! Our latest project dives into trends and insights that drive business decisions. 📊✨ #DataAnalysis #YDanmalamaSolutions
Prompt: (Create an image that represents the benefits of Power BI), (data visualization), (dynamic graphs), (insightful dashboards), (business analytics), (collaborative work environment), (modern design), (vibrant colors), (clear visual storytelling), (high impact presentation), (ultra-detailed), (4K quality), (focus on clarity and accessibility).
Prompt: website designing
Prompt: Create background image in the statistical room.  There is a chart display there.  bright themed.  With light green walls.  there is a bookshelf and also an imac monitor. make more closer to the wall. more realistic please. More zoom
Prompt: (clever visualization of tracking SaaS metrics), modern dashboard, vibrant colors, sleek user interface, charts and graphs displaying growth, professional atmosphere, dynamic elements highlighting key performance indicators, technology-driven, high detail, user-friendly design, professional workspace, 4K resolution, engaging and informative vibe.
Prompt: setup labtop monitor office  with white 
background
Prompt: A split-screen animation: on one side, a team struggling with traditional content creation methods; on the other, Prompt Engineers swiftly generating high-quality content using AI, saving time and costs.
Prompt: Create image of a business office from above with laptops and positive graphs on laptops.
Prompt: /imagine Create an image of a quantitative trader analyzing 8 to 10 computer monitors displaying various charts, numerical data, prices, trading plans, risk management strategies, and programming code. Use a color scheme of purple, pink, green, black, and white. The scene should be dynamic and professional, capturing the intensity and focus of the trader.
Prompt: 
Programmer engineer early in the morning, coding
Prompt: taxes blog
Prompt: a computer-desk with some forex-charts which are dispaleyd at the monitor
Prompt: Create an image of an AI software that can help nonprofits solve problems like fundraising
Prompt: create a modern background for desktop.  Dark colours with finance and trading themes
Prompt: trader sitting in front of a desk trading 
at home at night raining facing the back dark room
Prompt: making pregrams on laptop
Prompt: Power BI dashboard, developer working on it in their home office, yellow wall paint, cozy and focused atmosphere, warm lighting, organized workspace, modern tech gadgets, laptop screen displaying vibrant Power BI charts, shelves with books and plants in the background, natural light from a window, ultra-detailed, 4K, HD, photorealistic, professional and clean design, high depth of field, cinematic colors, intricate details, Fulton Analytics signs in the background
Prompt: Imagine a space where trading cryptocurrencies feels like stepping into the future! In this setup, you have a super cool desk and chair combo. The desk has a touch screen built right into it, like something from a sci-fi movie. Plus, it has wireless chargers for your gadgets, so no more messy cables!You've got these awesome curved screens surrounding you, showing all the crypto charts and market info you need. They're like big windows into the crypto world. And they're super clear, with no annoying borders, making you feel totally immersed.There's this magical hologram thingy that shows 3D crypto data floating in the air. It's like having your own personal crypto wizard giving you advice!Forget about keyboards and mice. You can control everything with just your hands! Swipe, tap, and wave to move around the screens and make trades. It's like you're controlling things with magic!Underneath the desk and behind the screens, there are these cool lights that change colors based on what's happening in the crypto world. It's like your own light show, making everything feel even more futuristic.Meet your new crypto buddy – an AI assistant that helps you out with trading tips and alerts. It's like having a super-smart friend guiding you through the crypto jungle.To top it off, there are awesome posters and displays showing crypto stuff all around. It's like being in a crypto art gallery!And don't worry about security. There are fancy fingerprint scanners and face recognition thingies to keep your crypto stash safe.You can customize everything to fit your style. Change the colors, add your own wallpapers – make it feel like home!So, get ready to dive into the future of crypto trading with this amazing setup. It's like having your own crypto spaceship, ready to take you on an adventure to the moon and beyond!
Prompt: invests nasdaq100 futures trading focusing on monitor showing candles
Prompt: create desktop background with Wall street theme. Financial dark colors
Prompt: Estrategia de Marketing Digital:
"Una ilustración colorida de un equipo de marketing trabajando en una estrategia digital, con gráficos y pantallas que muestran estadísticas de redes sociales y análisis de datos."
Prompt:
Prompt: Microsoft Power BI dashboard, working on it in their home office, wall sign saying "Fulton Analytics" yellow wall paint, cozy and focused atmosphere, warm lighting, organized workspace, modern tech gadgets, bottle of whiskey on desk, laptop screen displaying vibrant Power BI charts, shelves with books and plants in the background, natural light from a big oversized window, ultra-detailed, 4K, HD, photorealistic, professional and clean design, high depth of field, cinematic colors, intricate details,
Prompt: a monitor and a smartphone is  sitting close by.  They are both showing something similar.  That is some telecom data analysis in the User Interface.  They are both on a table with no human in the picture.  the image should be simple and zen-like.
Prompt: give a real picture of trading on three monitors using trading view
Prompt: Web video online business owner designing digital products